Last Saturday, I got
chance to attend "Log Aggregation and Analysis using Elastic Stack" meetup, organized at Ishi Systems, Ahmedabad. Thanks to Dhaval Mehta, speaker of this
meetup, who imparted excellent presentation
of this topic along with practical demo.
My key Learning from this meetup is: To
accomplish common use cases like Log aggregation and analysis, it's all about
investing initial efforts for installation and configuration of open source
Elastic Stack (Beats, Logstash, Elasticsearch and Kibana). Apparently, no
development efforts are required.
Then, after
exploring and playing with Elastic Stack for few hours, I thought to write this
post today. In my view, with the release of Elastic Stack 5.0.0 in October 2016, now getting started with Elasticsearch
and associated products is a piece of cake.
Everything (Elasticsearch, Kibana, Beats, Logstash,
and X-Pack) is well aligned, tested and released together in Elastic Stack.
What does it mean to newbie? Well, earlier individuals were responsible
to choose, integrate and test best suitable version of products or plugings to
accomplish overall Elasticsearch based solution. For example, which plugin to
use with Elasticsearch for monitoring, mavel or head plugin? Which version of
Logstash or of any other supported tooling will work impeccably with
Elasticsearch 1.x or Elasticsearch 2.x? Now, with Elastic Stack version 5.0 onwards, one
gets production ready harmonized products. That means, overall experience to
deploy and manage Elastic Stack is anticipated to be stable and more graceful
than earlier.
The Open Source Elastic Stack = Reliably and
securely take data from any source, in any format, and search, analyze,
and visualize it in real time. Be aware, X-Pack
is commercial offering.
|
Products
|
Description (see for detail)
|
Essential Information
|
|
Visualize your data and navigate the Elastic Stack
using Kibana.
Kibana gives shape
to your data and is the extensible user interface for configuring and
managing all aspects of the Elastic Stack.
|
|
|
|
Store, search, and analyze your data using
Elasticsearch.
Elasticsearch is a
distributed, JSON-based search and analytics engine, designed for horizontal
scalability, reliability, and easy management.
|
|
|
|
Centralize, Transform & Stash Your Data using
Logstash.
Logstash is an
open source, server-side data processing pipeline that ingests data from a
multitude of sources simultaneously, transforms it, and then sends it to your
favorite “stash.” It has a rich, extensible plugin ecosystem and strong
Elasticsearch synergy.
|
|
|
|
Lightweight Data Shippers.
Beats is the
platform for single-purpose data shippers. They install as lightweight agents
and send data from hundreds or thousands of machines to Logstash or
Elasticsearch.
|
|
|
|
Security (formerly Shield), Altering (via Watcher),
Monitoring (formerly Marvel), Graph and Reporting using X-Pack.
X-Pack
has features built and maintained by Elastic engineers that integrate across
the Elastic Stack.
|
|
How to get started with
Elasticsearch 5.x?
First of all,
understand basic concepts of Elasticsearch (cluster, node, index, type, document, shards and
replicas) + see slide @ Elasticsearch as a search alternative to a relational database + watch webcast @ Your Data, Your Search, Elasticsearch.
Try fundamental
Elasticsearch REST APIs for exploring cluster, modifying your data and explore your data practically. For this, mainly two options available:
- Install Elasticsearch on your local machine
- Leverage 14 days trial of Elastic Cloud
Option 1: Install
Elasticsearch on your local machine
For learning
Elasticsearch for long term interest, installing it locally could be good
option. Here, you have multiple options.
- Just install Elasticsearch and try REST APIs using your choice of REST client tool such as postman, curl, etc.
- Use Elasticsearch docker image, if you are fan of docker.
- Install Elasticsearch -> Kibana -> X-Pack. Personally, I prefer this option.
If you install
Elasticsearch, Kibana and X-Pack, then login Kibana (http://localhost:5601/) using default
username/password (elastic / changeme). Then, use "Dev Tools" to play
with Elasticsearch REST APIs & see how Elasticsearch clusters, nodes and
indices react in "Monitoring" section.
Option 2: Leverage 14 days
trial of Elastic Cloud
If you don't wish to
install Elasticsearch locally, may be because you are just interested in
exploring fundamentals, then just go for leveraging Elastic Cloud to get
started with it.
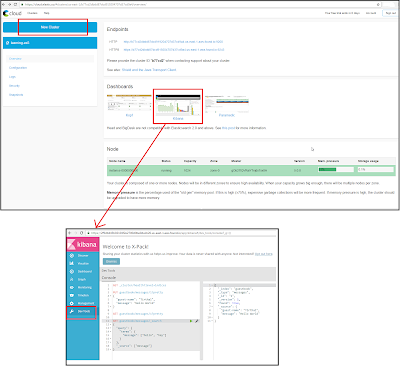
- Sign up to Elastic Cloud and Login
- Create new cluster and preserve the password which you get at the end
- Open Kibana UI and login using the password which you got in previous step, and use "Dev Tools" section to play with Elasticsearch REST APIs
Disclaimer
I am not biased to
promote any particular free or commercial products offering, rather my
objective is limited to share my own experience.


